|
|
| Week End Date | Total Catch (Includes unflipped trips only) |
||||||||
|---|---|---|---|---|---|---|---|---|---|
| Kept | Discard | Catch | Cumulative Catch | Cumulative Catch | |||||
| Rep. | Est. | Rep. | Est. | Rep. | Est. | Rep. | Est. | ||
| Lbs (Hail Wt.) |
Lbs (Hail Wt.) |
Lbs (Hail Wt.) |
Lbs (Hail Wt.) |
Lbs (Hail Wt.) |
Lbs (Hail Wt.) |
Lbs (Hail Wt.) |
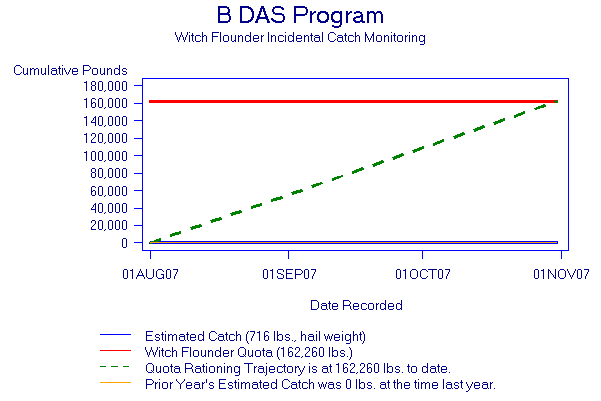
% of Quota (162,260 lbs.) |
% of Quota (162,260 lbs.) |
|
| 8/1 - 9/20 | 110 | 0 | 18 | 110 | 128 | 110 | 128 | <1% | <1% |
| 9/27 | 60 | 0 | 8 | 60 | 68 | 170 | 196 | <1% | <1% |
| 10/4 | 230 | 0 | 0 | 230 | 230 | 400 | 426 | <1% | <1% |
| 10/11 | 0 | 0 | 0 | 0 | 0 | 400 | 426 | <1% | <1% |
| 10/18 | 0 | 0 | 0 | 0 | 0 | 400 | 426 | <1% | <1% |
| 10/25 | 0 | 0 | 0 | 0 | 0 | 400 | 426 | <1% | <1% |
| 11/1 | 290 | 0 | 0 | 290 | 290 | 690 | 716 | <1% | <1% |
| Total VMS | 690 | 0 | 26 | 690 | 716 | . | . | . | . |
|