|
| Species | Bushels* | Percent of Quota* |
Quota (Bushels) |
|---|---|---|---|
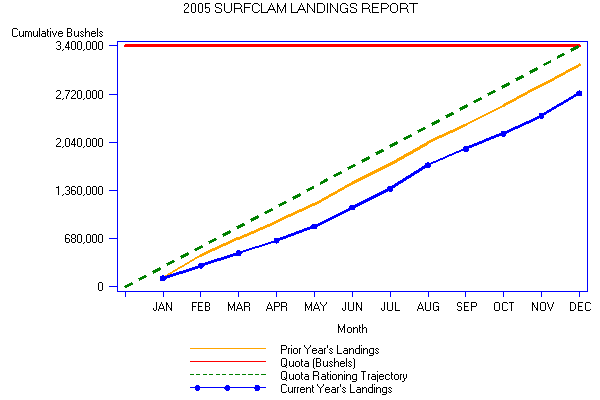
| SURFCLAM | 2,734,564 | 80.4 | 3,400,000 |
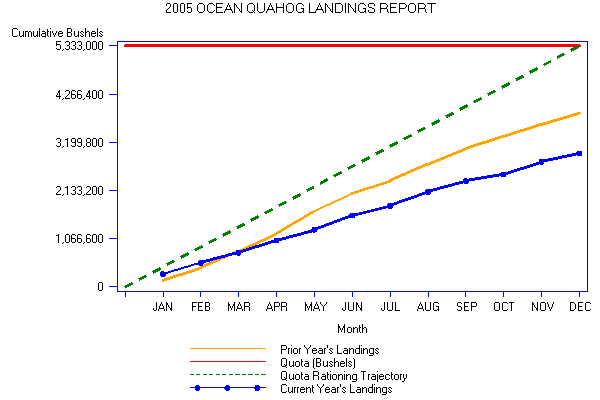
| OCEAN QUAHOG | 2,958,980 | 55.5 | 5,333,000 |
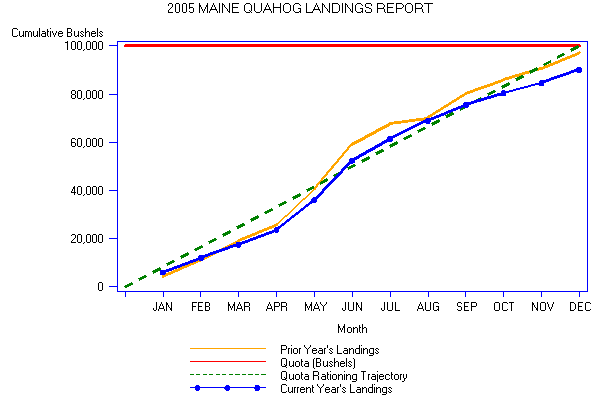
| MAINE QUAHOG | 90,142 | 90.1 | 100,000 |
|
|
| Species | Bushels* | Percent of Quota* |
Quota (Bushels) |
|---|---|---|---|
| SURFCLAM | 2,734,564 | 80.4 | 3,400,000 |
| OCEAN QUAHOG | 2,958,980 | 55.5 | 5,333,000 |
| MAINE QUAHOG | 90,142 | 90.1 | 100,000 |
|
| 2005 Surfclam/Ocean Quahog Landings by period |
| Period | Begin Date |
End Date |
Surfclam Bushels |
Surfclam Bushels (Cumulative) |
Ocean Quahog Bushels |
Ocean Quahog Bushels (Cumulative) |
Maine Quahog Bushels |
Maine Quahog Bushels (Cumulative) |
|---|---|---|---|---|---|---|---|---|
| 01 | 01-JAN | 15-JAN | 85,792 | 85,792 | 165,388 | 165,388 | 2,843 | 2,843 |
| 02 | 16-JAN | 31-JAN | 39,360 | 125,152 | 122,942 | 288,330 | 3,271 | 6,114 |
| 03 | 01-FEB | 15-FEB | 97,664 | 222,816 | 144,386 | 432,717 | 3,487 | 9,601 |
| 04 | 16-FEB | 28-FEB | 81,504 | 304,320 | 104,753 | 537,470 | 2,524 | 12,125 |
| 05 | 01-MAR | 15-MAR | 82,496 | 386,816 | 92,296 | 629,767 | 2,905 | 15,030 |
| 06 | 16-MAR | 31-MAR | 91,456 | 478,272 | 132,687 | 762,455 | 2,636 | 17,666 |
| 07 | 01-APR | 15-APR | 90,368 | 568,640 | 130,097 | 892,553 | 2,703 | 20,369 |
| 08 | 16-APR | 30-APR | 89,440 | 658,080 | 142,712 | 1,035,265 | 3,390 | 23,759 |
| 09 | 01-MAY | 15-MAY | 97,664 | 755,744 | 102,637 | 1,137,903 | 4,355 | 28,114 |
| 10 | 16-MAY | 31-MAY | 101,568 | 857,312 | 135,183 | 1,273,087 | 7,946 | 36,060 |
| 11 | 01-JUN | 15-JUN | 125,856 | 983,168 | 154,715 | 1,427,802 | 5,486 | 41,546 |
| 12 | 16-JUN | 30-JUN | 141,728 | 1,124,896 | 160,279 | 1,588,082 | 10,976 | 52,522 |
| 13 | 01-JUL | 15-JUL | 113,408 | 1,238,304 | 89,474 | 1,677,556 | 5,347 | 57,869 |
| 14 | 16-JUL | 31-JUL | 150,944 | 1,389,248 | 122,647 | 1,800,204 | 3,675 | 61,544 |
| 15 | 01-AUG | 15-AUG | 150,432 | 1,539,680 | 151,264 | 1,951,468 | 0 | 61,544 |
| 16 | 16-AUG | 31-AUG | 180,512 | 1,720,192 | 153,964 | 2,105,432 | 7,483 | 69,027 |
| 17 | 01-SEP | 15-SEP | 112,256 | 1,832,448 | 121,883 | 2,227,316 | 3,714 | 72,741 |
| 18 | 16-SEP | 30-SEP | 117,504 | 1,949,952 | 120,597 | 2,347,913 | 2,851 | 75,592 |
| 19 | 01-OCT | 15-OCT | 88,928 | 2,038,880 | 83,640 | 2,431,553 | 2,372 | 77,964 |
| 20 | 16-OCT | 31-OCT | 127,360 | 2,166,240 | 64,818 | 2,496,372 | 2,484 | 80,448 |
| 21 | 01-NOV | 15-NOV | 143,136 | 2,309,376 | 146,722 | 2,643,094 | 2,458 | 82,906 |
| 22 | 16-NOV | 30-NOV | 108,344 | 2,417,720 | 131,832 | 2,774,927 | 1,763 | 84,669 |
| 23 | 01-DEC | 15-DEC | 162,800 | 2,580,520 | 80,625 | 2,855,552 | 1,986 | 86,655 |
| 24 | 16-DEC | 31-DEC | 154,044 | 2,734,564 | 103,428 | 2,958,980 | 3,487 | 90,142 |
| Totals:* | 2,734,564 | 2,958,980 | 90,142 |
|