|
|
| Week End Date |
Declared US/Canada Program (1) | Declared B DAS Program (2) (Includes flipped and unflipped trips) |
Declared Eastern Area Haddock SAP (3) | ||||||||||||
|---|---|---|---|---|---|---|---|---|---|---|---|---|---|---|---|
| Kept | Discard | Catch | Kept | Discard | Catch | Kept | Discard | Catch | |||||||
| Rep. | Est. | Rep. | Est. | Rep. | Est. | Rep. | Est. | Rep. | Est. | Rep. | Est. | ||||
| Lbs (Hail Wt.) |
Lbs (Hail Wt.) |
Lbs (Hail Wt.) |
Lbs (Hail Wt.) |
Lbs (Hail Wt.) |
Lbs (Hail Wt.) |
Lbs (Hail Wt.) |
Lbs (Hail Wt.) |
Lbs (Hail Wt.) |
Lbs (Hail Wt.) |
Lbs (Hail Wt.) |
Lbs (Hail Wt.) |
Lbs (Hail Wt.) |
Lbs (Hail Wt.) |
Lbs (Hail Wt.) |
|
| 5/1-3/22 | 181,939 | 143,479 | 220,857 | 325,418 | 402,796 | 9,170 | 180 | 0 | 9,350 | 9,170 | 1,150 | 46 | 136 | 1,196 | 1,286 |
| 3/29 | 9,465 | 910 | 9,835 | 10,375 | 19,300 | 1,548 | 4,825 | 3,384 | 6,373 | 4,933 | 0 | 0 | 0 | 0 | 0 |
| 4/5 | 13,402 | 2,165 | 14,889 | 15,567 | 28,291 | 2,414 | 6,250 | 5,640 | 8,664 | 8,054 | 0 | 0 | 0 | 0 | 0 |
| 4/12 | 29,710 | 2,913 | 26,402 | 32,623 | 56,112 | 0 | 0 | 0 | 0 | 0 | 0 | 0 | 0 | 0 | 0 |
| 4/19 | 22,435 | 7,925 | 17,576 | 30,360 | 40,011 | 0 | 0 | 0 | 0 | 0 | 0 | 0 | 0 | 0 | 0 |
| 4/26 | 96,695 | 27,283 | 87,714 | 123,978 | 184,409 | 5,250 | 40 | 0 | 5,290 | 5,250 | 0 | 0 | 0 | 0 | 0 |
| 5/3 | 16,200 | 14,480 | 10,447 | 30,680 | 26,647 | 775 | 0 | 0 | 775 | 775 | 0 | 0 | 0 | 0 | 0 |
| Total | 369,846 | 199,155 | 387,720 | 569,001 | 757,566 | 19,157 | 11,295 | 9,024 | 30,452 | 28,182 | 1,150 | 46 | 136 | 1,196 | 1,286 |
| Week End Date |
Declared US/Canada and Haddock SAP (4) | Total Eastern US/Canada Area (1) + (2) + (3) + (4) | ||||||||||||
|---|---|---|---|---|---|---|---|---|---|---|---|---|---|---|
| Kept | Discard | Catch | Kept | Discard | Catch | Cumulative Catch | Cumulative Catch | |||||||
| Rep. | Est. | Rep. | Est. | Rep. | Est. | Rep. | Est. | Rep. | Est. | Rep. | Est. | |||
| Lbs (Hail Wt.) |
Lbs (Hail Wt.) |
Lbs (Hail Wt.) |
Lbs (Hail Wt.) |
Lbs (Hail Wt.) |
Lbs (Hail Wt.) |
Lbs (Hail Wt.) |
Lbs (Hail Wt.) |
Lbs (Hail Wt.) |
Lbs (Hail Wt.) |
Lbs (Hail Wt.) |
Lbs (Hail Wt.) |
% of Quota |
% of Quota |
|
| 5/1-3/22 | 0 | 0 | 0 | 0 | 0 | 192,259 | 143,705 | 220,993 | 335,964 | 413,252 | 335,964 | 413,252 | 40.7 | 50.1 |
| 3/29 | 0 | 0 | 0 | 0 | 0 | 11,013 | 5,735 | 13,219 | 16,748 | 24,233 | 352,712 | 437,485 | 42.8 | 53.1 |
| 4/5 | 0 | 0 | 0 | 0 | 0 | 15,816 | 8,415 | 20,529 | 24,231 | 36,345 | 376,943 | 473,830 | 45.7 | 57.5 |
| 4/12 | 0 | 0 | 0 | 0 | 0 | 29,710 | 2,913 | 26,402 | 32,623 | 56,112 | 409,566 | 529,942 | 49.7 | 64.3 |
| 4/19 | 0 | 0 | 0 | 0 | 0 | 22,435 | 7,925 | 17,576 | 30,360 | 40,011 | 439,926 | 569,953 | 53.4 | 69.1 |
| 4/26 | 0 | 0 | 0 | 0 | 0 | 101,945 | 27,323 | 87,714 | 129,268 | 189,659 | 569,194 | 759,612 | 69.0 | 92.1 |
| 5/3 | 0 | 0 | 0 | 0 | 0 | 16,975 | 14,480 | 10,447 | 31,455 | 27,422 | 600,649 | 787,034 | 72.8 | 95.5 |
| Total | 0 | 0 | 0 | 0 | 0 | 390,153 | 210,496 | 396,880 | 600,649 | 787,034 | . | . | ||
| Estimated Landings Equivalent to Dealers' Reports |
Total Eastern US/Canada Area | ||||||
|---|---|---|---|---|---|---|---|
| Cumulative Kept |
Cumulative Discard |
Cumulative Catch |
Cumulative Catch |
||||
| Reported | Estimated | Reported | Estimated | Reported | Estimated | ||
| Lbs (Live Wt.) |
Lbs (Live Wt.) |
Lbs (Live Wt.) |
Lbs (Live Wt.) |
Lbs (Live Wt.) |
Percent of Quota (824,529 lbs.) |
Percent of Quota (824,529 lbs.) |
|
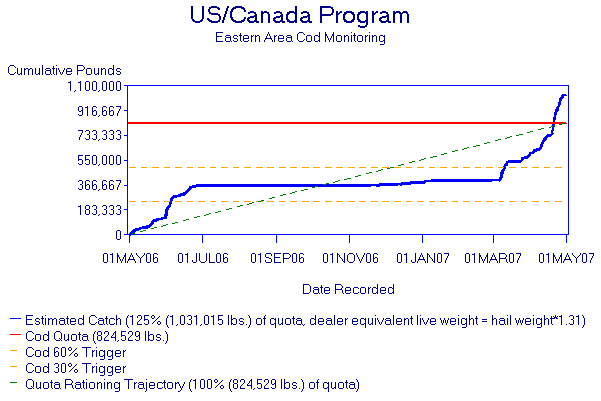
| Live Weight = Hail Weight*1.31 | 511,101 | 275,750 | 519,913 | 786,851 | 1,031,014 | 95.4 | 125.0 |
|