|
|
| Week End Date |
Declared US/Canada Program (1) | Declared B DAS Program (2) (Includes flipped and unflipped trips) |
Declared Eastern Area Haddock SAP (3) | ||||||||||||
|---|---|---|---|---|---|---|---|---|---|---|---|---|---|---|---|
| Kept | Discard | Catch | Kept | Discard | Catch | Kept | Discard | Catch | |||||||
| Rep. | Est. | Rep. | Est. | Rep. | Est. | Rep. | Est. | Rep. | Est. | Rep. | Est. | ||||
| Lbs (Hail Wt.) |
Lbs (Hail Wt.) |
Lbs (Hail Wt.) |
Lbs (Hail Wt.) |
Lbs (Hail Wt.) |
Lbs (Hail Wt.) |
Lbs (Hail Wt.) |
Lbs (Hail Wt.) |
Lbs (Hail Wt.) |
Lbs (Hail Wt.) |
Lbs (Hail Wt.) |
Lbs (Hail Wt.) |
Lbs (Hail Wt.) |
Lbs (Hail Wt.) |
Lbs (Hail Wt.) |
|
| 5/1-3/22 | 556,892 | 94,510 | 237,478 | 651,402 | 794,370 | 19,265 | 15,684 | 0 | 34,949 | 19,265 | 11,063 | 1,263 | 9,332 | 12,326 | 20,395 |
| 3/29 | 4,333 | 1,501 | 2,254 | 5,834 | 6,587 | 640 | 653 | 120 | 1,293 | 760 | 0 | 0 | 0 | 0 | 0 |
| 4/5 | 7,430 | 1,370 | 3,869 | 8,800 | 11,299 | 1,100 | 120 | 331 | 1,220 | 1,431 | 0 | 0 | 0 | 0 | 0 |
| 4/12 | 35,593 | 3,210 | 23,947 | 38,803 | 59,540 | 0 | 0 | 0 | 0 | 0 | 0 | 0 | 0 | 0 | 0 |
| 4/19 | 24,940 | 3,940 | 24,760 | 28,880 | 49,700 | 0 | 0 | 0 | 0 | 0 | 0 | 0 | 0 | 0 | 0 |
| 4/26 | 179,225 | 69,615 | 184,625 | 248,840 | 363,850 | 3,075 | 0 | 0 | 3,075 | 3,075 | 0 | 0 | 0 | 0 | 0 |
| 5/3 | 24,290 | 1,825 | 29,851 | 26,115 | 54,141 | 275 | 0 | 0 | 275 | 275 | 0 | 0 | 0 | 0 | 0 |
| Total | 832,703 | 175,971 | 506,784 | 1,008,674 | 1,339,487 | 24,355 | 16,457 | 451 | 40,812 | 24,806 | 11,063 | 1,263 | 9,332 | 12,326 | 20,395 |
| Week End Date |
Declared US/Canada and Haddock SAP (4) | Total Eastern US/Canada Area (1) + (2) + (3) + (4) | ||||||||||||
|---|---|---|---|---|---|---|---|---|---|---|---|---|---|---|
| Kept | Discard | Catch | Kept | Discard | Catch | Cumulative Catch | Cumulative Catch | |||||||
| Rep. | Est. | Rep. | Est. | Rep. | Est. | Rep. | Est. | Rep. | Est. | Rep. | Est. | |||
| Lbs (Hail Wt.) |
Lbs (Hail Wt.) |
Lbs (Hail Wt.) |
Lbs (Hail Wt.) |
Lbs (Hail Wt.) |
Lbs (Hail Wt.) |
Lbs (Hail Wt.) |
Lbs (Hail Wt.) |
Lbs (Hail Wt.) |
Lbs (Hail Wt.) |
Lbs (Hail Wt.) |
Lbs (Hail Wt.) |
% of Quota |
% of Quota |
|
| 5/1-3/22 | 0 | 0 | 0 | 0 | 0 | 587,220 | 111,457 | 246,810 | 698,677 | 834,030 | 698,677 | 834,030 | 4.2 | 5.1 |
| 3/29 | 0 | 0 | 0 | 0 | 0 | 4,973 | 2,154 | 2,374 | 7,127 | 7,347 | 705,804 | 841,377 | 4.3 | 5.1 |
| 4/5 | 0 | 0 | 0 | 0 | 0 | 8,530 | 1,490 | 4,200 | 10,020 | 12,730 | 715,824 | 854,107 | 4.3 | 5.2 |
| 4/12 | 0 | 0 | 0 | 0 | 0 | 35,593 | 3,210 | 23,947 | 38,803 | 59,540 | 754,627 | 913,647 | 4.6 | 5.5 |
| 4/19 | 0 | 0 | 0 | 0 | 0 | 24,940 | 3,940 | 24,760 | 28,880 | 49,700 | 783,507 | 963,347 | 4.8 | 5.8 |
| 4/26 | 0 | 0 | 0 | 0 | 0 | 182,300 | 69,615 | 184,625 | 251,915 | 366,925 | 1,035,422 | 1,330,272 | 6.3 | 8.1 |
| 5/3 | 0 | 0 | 0 | 0 | 0 | 24,565 | 1,825 | 29,851 | 26,390 | 54,416 | 1,061,812 | 1,384,688 | 6.4 | 8.4 |
| Total | 0 | 0 | 0 | 0 | 0 | 868,121 | 193,691 | 516,567 | 1,061,812 | 1,384,688 | . | . | ||
| Estimated Landings Equivalent to Dealers' Reports |
Total Eastern US/Canada Area | ||||||
|---|---|---|---|---|---|---|---|
| Cumulative Kept |
Cumulative Discard |
Cumulative Catch |
Cumulative Catch |
||||
| Reported | Estimated | Reported | Estimated | Reported | Estimated | ||
| Lbs (Live Wt.) |
Lbs (Live Wt.) |
Lbs (Live Wt.) |
Lbs (Live Wt.) |
Lbs (Live Wt.) |
Percent of Quota (16,490,580 lbs.) |
Percent of Quota (16,490,580 lbs.) |
|
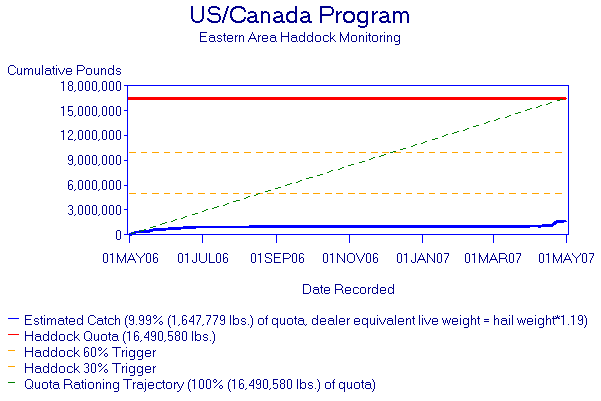
| Live Weight = Hail Weight*1.19 | 1,033,064 | 230,492 | 614,715 | 1,263,556 | 1,647,779 | 7.7 | 10.0 |
|