|
|
| Week End Date |
Declared US/Canada Program (1) | Declared B DAS Program (2) (Includes flipped and unflipped trips) |
Declared Eastern Area Haddock SAP (3) | ||||||||||||
|---|---|---|---|---|---|---|---|---|---|---|---|---|---|---|---|
| Kept | Discard | Catch | Kept | Discard | Catch | Kept | Discard | Catch | |||||||
| Rep. | Est. | Rep. | Est. | Rep. | Est. | Rep. | Est. | Rep. | Est. | Rep. | Est. | ||||
| Lbs (Hail Wt.) |
Lbs (Hail Wt.) |
Lbs (Hail Wt.) |
Lbs (Hail Wt.) |
Lbs (Hail Wt.) |
Lbs (Hail Wt.) |
Lbs (Hail Wt.) |
Lbs (Hail Wt.) |
Lbs (Hail Wt.) |
Lbs (Hail Wt.) |
Lbs (Hail Wt.) |
Lbs (Hail Wt.) |
Lbs (Hail Wt.) |
Lbs (Hail Wt.) |
Lbs (Hail Wt.) |
|
| 5/1-3/20 | 236,857 | 109,286 | 491,119 | 346,143 | 727,977 | 3,420 | 10 | 0 | 3,430 | 3,420 | 0 | 0 | 0 | 0 | 0 |
| 3/27 | 0 | 0 | 0 | 0 | 0 | 0 | 0 | 0 | 0 | 0 | 0 | 0 | 0 | 0 | 0 |
| 4/3 | 0 | 0 | 0 | 0 | 0 | 0 | 0 | 0 | 0 | 0 | 0 | 0 | 0 | 0 | 0 |
| 4/10 | 0 | 0 | 0 | 0 | 0 | 0 | 0 | 0 | 0 | 0 | 0 | 0 | 0 | 0 | 0 |
| 4/17 | 0 | 0 | 0 | 0 | 0 | 0 | 0 | 0 | 0 | 0 | 0 | 0 | 0 | 0 | 0 |
| 4/24 | 0 | 0 | 0 | 0 | 0 | 0 | 0 | 0 | 0 | 0 | 0 | 0 | 0 | 0 | 0 |
| 5/1 | 0 | 0 | 0 | 0 | 0 | 0 | 0 | 0 | 0 | 0 | 0 | 0 | 0 | 0 | 0 |
| Total | 236,857 | 109,286 | 491,119 | 346,143 | 727,977 | 3,420 | 10 | 0 | 3,430 | 3,420 | 0 | 0 | 0 | 0 | 0 |
| Week End Date |
Declared US/Canada and Haddock SAP (4) | Total Eastern US/Canada Area (1) + (2) + (3) + (4) | ||||||||||||
|---|---|---|---|---|---|---|---|---|---|---|---|---|---|---|
| Kept | Discard | Catch | Kept | Discard | Catch | Cumulative Catch | Cumulative Catch | |||||||
| Rep. | Est. | Rep. | Est. | Rep. | Est. | Rep. | Est. | Rep. | Est. | Rep. | Est. | |||
| Lbs (Hail Wt.) |
Lbs (Hail Wt.) |
Lbs (Hail Wt.) |
Lbs (Hail Wt.) |
Lbs (Hail Wt.) |
Lbs (Hail Wt.) |
Lbs (Hail Wt.) |
Lbs (Hail Wt.) |
Lbs (Hail Wt.) |
Lbs (Hail Wt.) |
Lbs (Hail Wt.) |
Lbs (Hail Wt.) |
% of Quota |
% of Quota |
|
| 5/1-3/20 | 0 | 0 | 0 | 0 | 0 | 240,277 | 109,296 | 491,119 | 349,573 | 731,397 | 349,573 | 731,397 | 32.1 | 67.2 |
| 3/27 | 0 | 0 | 0 | 0 | 0 | 0 | 0 | 0 | 0 | 0 | 349,573 | 731,397 | 32.1 | 67.2 |
| 4/3 | 0 | 0 | 0 | 0 | 0 | 0 | 0 | 0 | 0 | 0 | 349,573 | 731,397 | 32.1 | 67.2 |
| 4/10 | 0 | 0 | 0 | 0 | 0 | 0 | 0 | 0 | 0 | 0 | 349,573 | 731,397 | 32.1 | 67.2 |
| 4/17 | 0 | 0 | 0 | 0 | 0 | 0 | 0 | 0 | 0 | 0 | 349,573 | 731,397 | 32.1 | 67.2 |
| 4/24 | 0 | 0 | 0 | 0 | 0 | 0 | 0 | 0 | 0 | 0 | 349,573 | 731,397 | 32.1 | 67.2 |
| 5/1 | 0 | 0 | 0 | 0 | 0 | 0 | 0 | 0 | 0 | 0 | 349,573 | 731,397 | 32.1 | 67.2 |
| Total | 0 | 0 | 0 | 0 | 0 | 240,277 | 109,296 | 491,119 | 349,573 | 731,397 | . | . | ||
| Estimated Landings Equivalent to Dealers' Reports |
Total Eastern US/Canada Area | ||||||
|---|---|---|---|---|---|---|---|
| Cumulative Kept |
Cumulative Discard |
Cumulative Catch |
Cumulative Catch |
||||
| Reported | Estimated | Reported | Estimated | Reported | Estimated | ||
| Lbs (Live Wt.) |
Lbs (Live Wt.) |
Lbs (Live Wt.) |
Lbs (Live Wt.) |
Lbs (Live Wt.) |
Percent of Quota (1,089,084 lbs.) |
Percent of Quota (1,089,084 lbs.) |
|
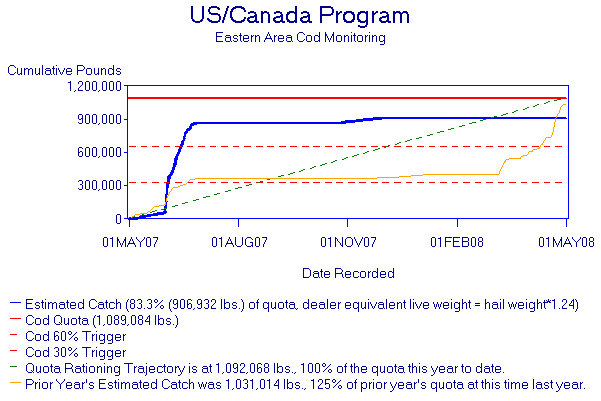
| Live Weight = Hail Weight*1.24 | 297,945 | 135,527 | 608,988 | 433,472 | 906,932 | 39.8 | 83.3 |
|