|
|
| Week End Date |
Declared US/Canada Program Eastern Area (1) | Declared B DAS Program Eastern Area (2) | All Eastern Area Haddock SAP (3) | ||||||||||||
|---|---|---|---|---|---|---|---|---|---|---|---|---|---|---|---|
| Kept | Discard | Catch | Kept | Discard | Catch | Kept | Discard | Catch | |||||||
| Rep. | Est. | Rep. | Est. | Rep. | Est. | Rep. | Est. | Rep. | Est. | Rep. | Est. | ||||
| Lbs | Lbs | Lbs | Lbs | Lbs | Lbs | Lbs | Lbs | Lbs | Lbs | Lbs | Lbs | Lbs | Lbs | Lbs | |
| 5/1-4/9 | 1,018,277 | 51,229 | 192,494 | 1,069,506 | 1,210,771 | 925 | 0 | 6 | 925 | 931 | 0 | 0 | 0 | 0 | 0 |
| 4/16 | 66,875 | 1,506 | 10,486 | 68,381 | 77,361 | 0 | 0 | 0 | 0 | 0 | 0 | 0 | 0 | 0 | 0 |
| 4/23 | 35,865 | 826 | 8,108 | 36,691 | 43,973 | 0 | 0 | 0 | 0 | 0 | 0 | 0 | 0 | 0 | 0 |
| 4/30 | 1,900 | 0 | 264 | 1,900 | 2,164 | 0 | 0 | 0 | 0 | 0 | 0 | 0 | 0 | 0 | 0 |
| Total | 1,122,917 | 53,561 | 211,352 | 1,176,478 | 1,334,269 | 925 | 0 | 6 | 925 | 931 | 0 | 0 | 0 | 0 | 0 |
| Week End Date |
Declared US/Canada Program Western Area (4) | Declared B DAS Program Western Area (5) | Scallop Open Area in U.S./Canada Area (6)* | ||||||||||||
|---|---|---|---|---|---|---|---|---|---|---|---|---|---|---|---|
| Kept | Discard | Catch | Kept | Discard | Catch | Kept | Discard | Catch | |||||||
| Rep. | Est. | Rep. | Est. | Rep. | Est. | Rep. | Est. | Rep. | Est. | Rep. | Est. | ||||
| Lbs | Lbs | Lbs | Lbs | Lbs | Lbs | Lbs | Lbs | Lbs | Lbs | Lbs | Lbs | Lbs | Lbs | Lbs | |
| 5/1-4/9 | 1,056,286 | 80,152 | 236,814 | 1,136,438 | 1,293,100 | 10,200 | 5,950 | 213 | 16,150 | 10,413 | 0 | 0 | 419,985 | 0 | 419,986 |
| 4/16 | 7,765 | 0 | 714 | 7,765 | 8,479 | 0 | 0 | 0 | 0 | 0 | 0 | 0 | 2,072 | 0 | 2,072 |
| 4/23 | 47,920 | 1,016 | 4,423 | 48,936 | 52,343 | 0 | 0 | 0 | 0 | 0 | 0 | 0 | 1,208 | 0 | 1,208 |
| 4/30 | 89,050 | 2,536 | 12,390 | 91,586 | 101,440 | 0 | 0 | 0 | 0 | 0 | 0 | 0 | 1,055 | 0 | 1,055 |
| Total | 1,201,021 | 83,704 | 254,341 | 1,284,725 | 1,455,362 | 10,200 | 5,950 | 213 | 16,150 | 10,413 | 0 | 0 | 424,321 | 0 | 424,322 |
| Week End Date |
Declared Scallop Access Area (7) | Total US/Canada Area (1) + (2) + (3) + (4) + (5) + (6) + (7) | ||||||||||||
|---|---|---|---|---|---|---|---|---|---|---|---|---|---|---|
| Kept | Discard | Catch | Kept | Discard | Catch | Cumulative Catch | Cumulative Catch | |||||||
| Rep. | Est. | Rep. | Est. | Rep. | Est. | Rep. | Est. | Rep. | Est. | Rep. | Est. | |||
| Lbs | Lbs | Lbs | Lbs | Lbs | Lbs | Lbs | Lbs | Lbs | Lbs | Lbs | Lbs | % Quota | % Quota | |
| 5/1-4/9 | 0 | 0 | 0 | 0 | 0 | 2,085,688 | 137,331 | 849,513 | 2,223,019 | 2,935,201 | 2,223,019 | 2,935,201 | 54.0 | 71.2 |
| 4/16 | 0 | 0 | 0 | 0 | 0 | 74,640 | 1,506 | 13,272 | 76,146 | 87,912 | 2,299,165 | 3,023,113 | 55.8 | 73.4 |
| 4/23 | 0 | 0 | 0 | 0 | 0 | 83,785 | 1,842 | 13,739 | 85,627 | 97,524 | 2,384,792 | 3,120,638 | 57.9 | 75.7 |
| 4/30 | 0 | 0 | 0 | 0 | 0 | 90,950 | 2,536 | 13,709 | 93,486 | 104,659 | 2,478,278 | 3,225,297 | 60.2 | 78.3 |
| Total | 0 | 0 | 0 | 0 | 0 | 2,335,063 | 143,215 | 890,234 | 2,478,278 | 3,225,297 | . | |||
| Estimated Landings Equivalent to Dealers' Reports |
Total US/Canada Area | ||||||
|---|---|---|---|---|---|---|---|
| Cumulative Kept | Cumulative Discard | Cumulative Catch | Cumulative Catch | ||||
| Reported | Estimated | Reported | Estimated | Reported | Estimated | ||
| Lbs (Dealer Wt.) |
Lbs (Dealer Wt.) |
Lbs (Dealer Wt.) |
Lbs (Dealer Wt.) |
Lbs (Dealer Wt.) |
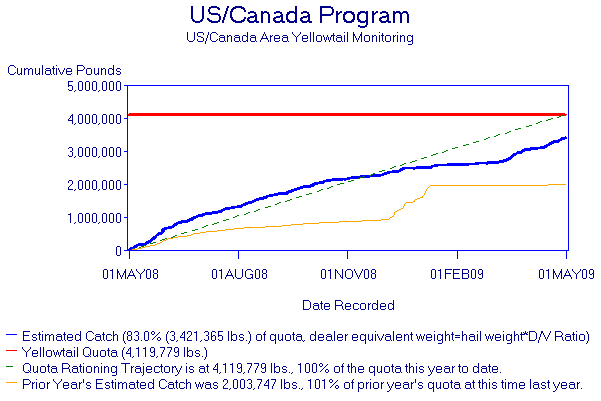
% of Quota (4,119,779 lbs.) |
% of Quota (4,119,779 lbs.) |
|
| Dealer Weight = VMS Hail Weight*D/V Ratio | 2,498,517 | 153,240 | 922,847 | 2,651,757 | 3,421,365 | 64.4 | 83.0 |
|