|
|
| Week End Date |
Declared US/Canada Program (1) | Declared B DAS Program (2) (Includes flipped and unflipped trips) |
Declared Eastern Area Haddock SAP (3) | ||||||||||||
|---|---|---|---|---|---|---|---|---|---|---|---|---|---|---|---|
| Kept | Discard | Catch | Kept | Discard | Catch | Kept | Discard | Catch | |||||||
| Rep. | Est. | Rep. | Est. | Rep. | Est. | Rep. | Est. | Rep. | Est. | Rep. | Est. | ||||
| Lbs (Hail Wt.) |
Lbs (Hail Wt.) |
Lbs (Hail Wt.) |
Lbs (Hail Wt.) |
Lbs (Hail Wt.) |
Lbs (Hail Wt.) |
Lbs (Hail Wt.) |
Lbs (Hail Wt.) |
Lbs (Hail Wt.) |
Lbs (Hail Wt.) |
Lbs (Hail Wt.) |
Lbs (Hail Wt.) |
Lbs (Hail Wt.) |
Lbs (Hail Wt.) |
Lbs (Hail Wt.) |
|
| 5/1-3/25 | 3,499,871 | 3,180 | 30,749 | 3,503,051 | 3,530,620 | 289,875 | 500 | 569 | 290,375 | 290,444 | 71,700 | 0 | 0 | 71,700 | 71,700 |
| 4/1 | 50,570 | 0 | 372 | 50,570 | 50,942 | 22,600 | 0 | 0 | 22,600 | 22,600 | 0 | 0 | 0 | 0 | 0 |
| 4/8 | 249,393 | 0 | 2,609 | 249,393 | 252,002 | 171,450 | 0 | 0 | 171,450 | 171,450 | 0 | 0 | 0 | 0 | 0 |
| 4/15 | 274,925 | 0 | 4,628 | 274,925 | 279,553 | 51,000 | 0 | 116 | 51,000 | 51,116 | 0 | 0 | 0 | 0 | 0 |
| 4/22 | 381,845 | 0 | 5,646 | 381,845 | 387,491 | 112,900 | 0 | 258 | 112,900 | 113,158 | 0 | 0 | 0 | 0 | 0 |
| 4/29 | 119,875 | 0 | 1,729 | 119,875 | 121,604 | 50 | 0 | 0 | 50 | 50 | 0 | 0 | 0 | 0 | 0 |
| 5/6 | 0 | 0 | 0 | 0 | 0 | 0 | 0 | 0 | 0 | 0 | 0 | 0 | 0 | 0 | 0 |
| Total | 4,576,479 | 3,180 | 45,733 | 4,579,659 | 4,622,212 | 647,875 | 500 | 943 | 648,375 | 648,818 | 71,700 | 0 | 0 | 71,700 | 71,700 |
| Week End Date |
Declared US/Canada and Haddock SAP (4) | Total Eastern US/Canada Area (1) + (2) + (3) + (4) | ||||||||||||
|---|---|---|---|---|---|---|---|---|---|---|---|---|---|---|
| Kept | Discard | Catch | Kept | Discard | Catch | Cumulative Catch | Cumulative Catch | |||||||
| Rep. | Est. | Rep. | Est. | Rep. | Est. | Rep. | Est. | Rep. | Est. | Rep. | Est. | |||
| Lbs (Hail Wt.) |
Lbs (Hail Wt.) |
Lbs (Hail Wt.) |
Lbs (Hail Wt.) |
Lbs (Hail Wt.) |
Lbs (Hail Wt.) |
Lbs (Hail Wt.) |
Lbs (Hail Wt.) |
Lbs (Hail Wt.) |
Lbs (Hail Wt.) |
Lbs (Hail Wt.) |
Lbs (Hail Wt.) |
% of Quota |
% of Quota |
|
| 5/1-3/25 | 39,000 | 0 | 0 | 39,000 | 39,000 | 3,900,446 | 3,680 | 31,318 | 3,904,126 | 3,931,764 | 3,904,126 | 3,931,764 | 16.0 | 16.1 |
| 4/1 | 0 | 0 | 0 | 0 | 0 | 73,170 | 0 | 372 | 73,170 | 73,542 | 3,977,296 | 4,005,306 | 16.3 | 16.4 |
| 4/8 | 0 | 0 | 0 | 0 | 0 | 420,843 | 0 | 2,609 | 420,843 | 423,452 | 4,398,139 | 4,428,758 | 18.0 | 18.1 |
| 4/15 | 0 | 0 | 0 | 0 | 0 | 325,925 | 0 | 4,744 | 325,925 | 330,669 | 4,724,064 | 4,759,427 | 19.3 | 19.4 |
| 4/22 | 0 | 0 | 0 | 0 | 0 | 494,745 | 0 | 5,904 | 494,745 | 500,649 | 5,218,809 | 5,260,076 | 21.3 | 21.5 |
| 4/29 | 0 | 0 | 0 | 0 | 0 | 119,925 | 0 | 1,729 | 119,925 | 121,654 | 5,338,734 | 5,381,730 | 21.8 | 22 |
| 5/6 | 0 | 0 | 0 | 0 | 0 | 0 | 0 | 0 | 0 | 0 | 5,338,734 | 5,381,730 | 21.8 | 22 |
| Total | 39,000 | 0 | 0 | 39,000 | 39,000 | 5,335,054 | 3,680 | 46,676 | 5,338,734 | 5,381,730 | . | . | ||
| Estimated Landings Equivalent to Dealers' Reports |
Total Eastern US/Canada Area | ||||||
|---|---|---|---|---|---|---|---|
| Cumulative Kept |
Cumulative Discard |
Cumulative Catch |
Cumulative Catch |
||||
| Reported | Estimated | Reported | Estimated | Reported | Estimated | ||
| Lbs (Live Wt.) |
Lbs (Live Wt.) |
Lbs (Live Wt.) |
Lbs (Live Wt.) |
Lbs (Live Wt.) |
Percent of Quota (24,470,616 lbs.) |
Percent of Quota (24,470,616 lbs.) |
|
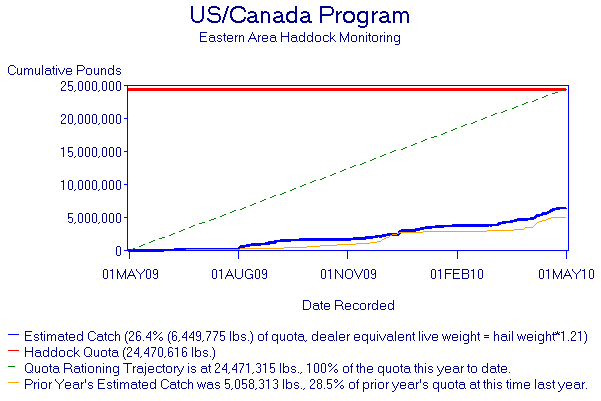
| Live Weight = Hail Weight*1.21 | 6,395,460 | 3,496 | 54,315 | 6,398,956 | 6,449,775 | 26.1 | 26.4 |
|